Getting this working was a journey of trial and error — I must have broken it a hundred different ways before landing on a solution that finally stuck. The goal sounded simple enough: run SonarQube analysis against my Unity project inside a Jenkins pipeline.
In practice, it turned out to be trickier than expected, thanks to the way Unity, Jenkins, and Sonar interact. In this post, I’ll walk through what I tried, what went wrong, and how I eventually got everything running smoothly with Jenkins inbound agents and Unity’s test runner.
This article will be documenting my own path to a solution, I am not an expert, much of this could be my unnecessary adventure and this problem is solved in a much simpler way, but I found it fun and wanted to talk about it. As is usually the case I could end up later learning about the “correct” ways to do this. Regardless I think others in my boat could still learn something from it.
Failed Attempts
# 1 – Running everything in a cloud linux box
My first idea was to run Unity directly in the cloud. I already had Jenkins and SonarQube running on a Fedora server in DigitalOcean, so I figured adding Unity to the mix would be straightforward.
Installing Unity wasn’t the problem — I got it downloaded and set up. The roadblock came with licensing. Unity requires license activation before it will run in batchmode, and on Linux that usually means either:
- validating through a graphical interface (not an option on a headless server), or
- using a Pro/Plus license with floating activation.
Since I only had a free license and no GUI available, I hit a dead end.
# 2 – Trying Unity Hub for license activation
The next idea was to use Unity Hub. Unlike the standalone Unity editor, Hub can manage licenses, and there’s some documentation suggesting it can be run in headless mode. On paper, that sounded like a way to bypass the GUI requirement.
In practice, it turned into a rabbit hole. Even in headless mode, Unity Hub still expects some form of display environment. I experimented with virtual displays (Xvfb and similar setups), but every attempt uncovered new blockers. After spending too much time chasing errors, I had to abandon this approach.
# 3 – Trying Unity DevOps
When I discovered Unity DevOps, it felt like the perfect solution. The freemium plan gives some build storage and enough runtime to handle a few builds per month. I set it up, and sure enough — Unity builds were running successfully in the cloud.
The catch came when I tried to hook those builds into SonarQube. Sonar has a very strict requirement: a C# solution must be compiled between two scanner commands:
BUT now how do we hook it into SonarQube? The issue is here seems that unity can build, and output artifacts including debug info, but SonarQube has a strict requirement that a C# solution needs to be run between two sonar scanner commands like this
SonarScanner.MSBuild.exe begin /k:"project-key" /d:sonar.login="myAuthenticationToken"
MSBuild.exe <path to solution.sln> /t:Rebuild
SonarScanner.MSBuild.exe end /d:sonar.login="myAuthenticationToken"
Unity DevOps can output artifacts (including debug info), but SonarQube doesn’t accept just the artifacts. The solution has to be rebuilt inside the same pipeline where SonarScanner is running. That requirement broke this approach — Unity could build in the cloud, but I couldn’t get the results back into Sonar in a usable way.
# 4 – Cloud Windows Server
Too expensive, required a GUI
#5 – Considering GitHub Workflows
This seemed like it could be an option but I never got around to trying it, seemed like without a GUI it would have ran into similar licensing issues. Without a reliable way to activate Unity, this approach would have just led to the same dead end as my cloud Linux attempts.
# 6 – Running it all locally
As a last resort — and a bit of an admission of defeat — I fell back to running everything locally. That meant Jenkins, SonarQube, and the Unity project were all on the same machine.
And yes, it technically worked. I could run builds, run tests, and push results into Sonar. But the limitations were obvious:
- It was offline by default, so setting up GitHub webhooks or external triggers wasn’t straightforward.
- It tied everything to a single machine, which meant switching laptops or collaborating with someone else was a huge headache.
- Maintaining Jenkins and SonarQube across multiple machines just wasn’t realistic.
This setup was fine for experimentation, but it was never going to become a long-term solution.
Solution: Using Inbound Agents
After all those failed attempts, I finally landed on a solution that worked. It wasn’t exactly what I had envisioned at the start, but for a solo developer it’s a solid compromise that balances flexibility and simplicity.
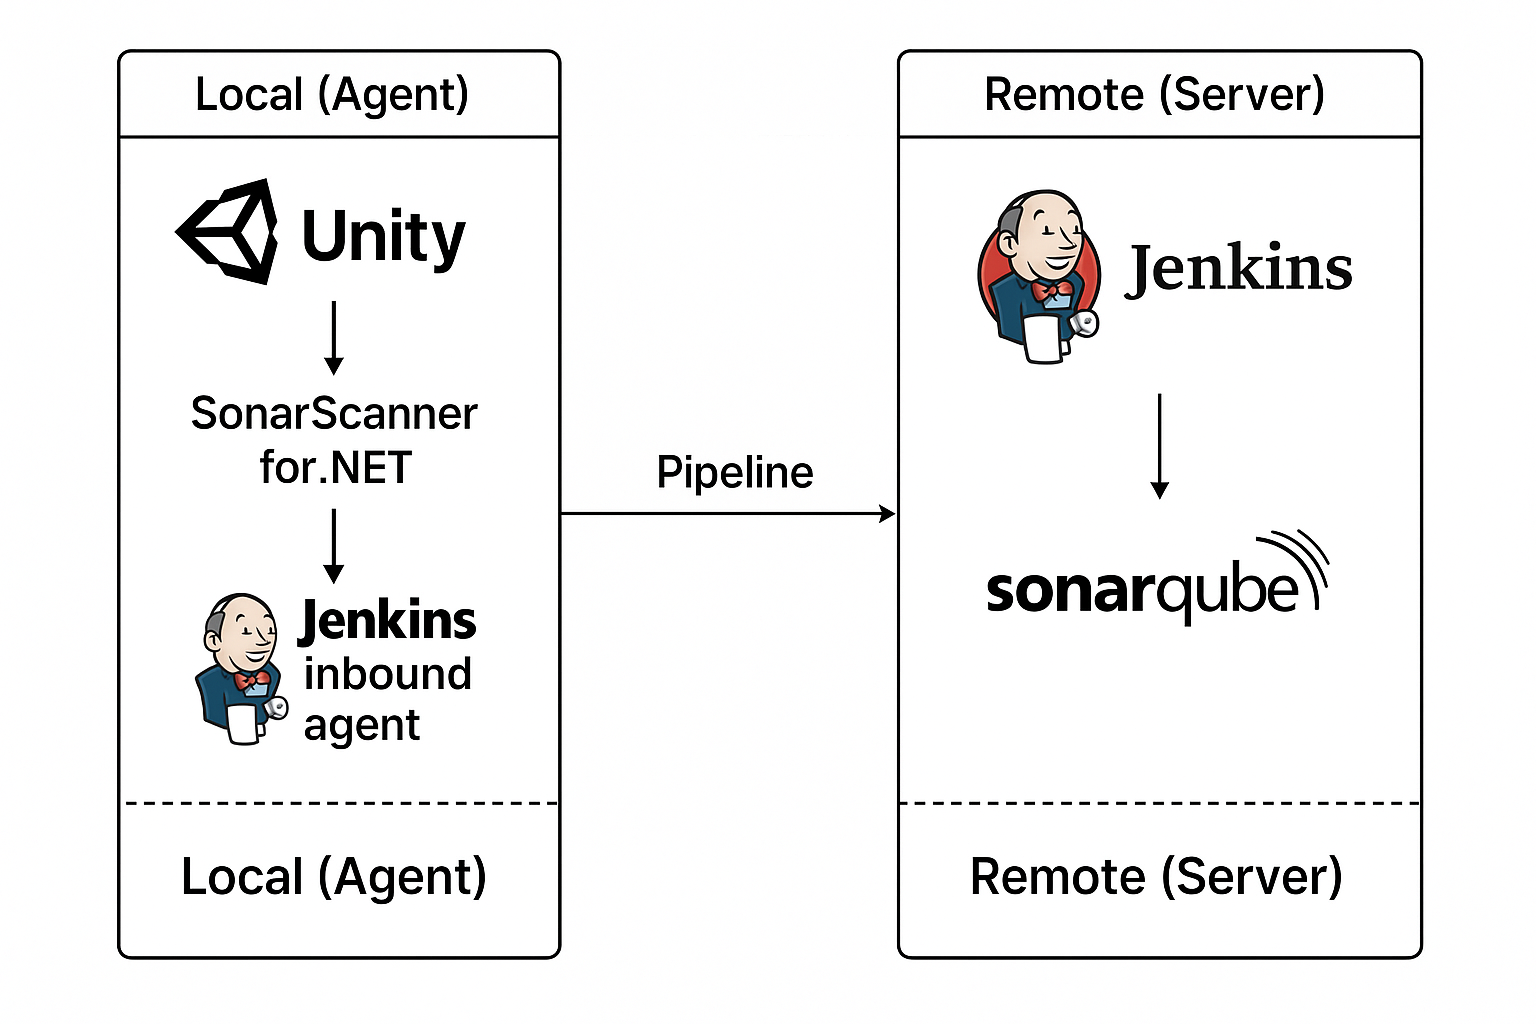
In this setup:
- Jenkins and SonarQube run remotely on a server.
- Unity Editor and the .NET SonarScanner run locally on my development machine.
- I connect my machine to Jenkins as an inbound agent, which allows the remote Jenkins controller to trigger Unity commands and Sonar scans directly on my laptop.
- The results are then published back to the remote Jenkins and SonarQube dashboards.
This flow avoids the licensing and headless issues I hit in the cloud, but still gives me the benefit of centralized dashboards and automation. It also scales just enough: with a bit of configuration (mainly setting environment variables for project paths and Unity executables), I can run the same pipeline on different local machines with minimal effort.
For a solo developer setup, this turned out to be the right balance — not completely in the cloud, but a reliable pipeline that runs Unity tests, gathers results, and feeds SonarQube analysis without fighting the tooling at every step.
This setup solves a lot of the headaches that come with trying to run Unity entirely in the cloud. By running the editor and scanner locally, I sidestep licensing hurdles, display issues, and awkward workarounds — while still getting centralized reporting through Jenkins and SonarQube.
Is it the ideal solution for a team? Probably not. A fully cloud-native build pipeline would scale better in a multi-developer environment. But for a solo developer, this approach strikes the right balance: I can keep using my development machine for Unity builds and tests, while Jenkins handles orchestration and SonarQube tracks code quality in one place.
Webhooks and Version Control
One nice advantage of this approach over running everything purely local is that Jenkins can still integrate with your version control system. That means you can trigger builds automatically on commits, pull request creation, or whatever event makes sense for your workflow.
So what happens if the agent (your local machine) is offline? In that case, Jenkins will simply queue the job until the agent comes back online. For me, this is perfect: I can raise a PR (yes, even review my own PRs), close my laptop for the night, and when I start working the next day, Jenkins picks up the queued pipeline and runs it.
This small detail makes the whole setup feel a lot more like a “real” CI system, even though the heavy lifting is still happening on my local development machine.
The Bad and the Ugly
I’ve called this setup a compromise for a reason — there are some rough edges worth pointing out:
- Unity Editor can’t run multiple instances. If my pipeline is running tests in Unity, I can’t use the same Editor instance for development at the same time. A possible workaround is installing multiple copies of the same Unity version and dedicating one just for pipelines.
- Builds only run when the local agent is online. If my laptop is off, Jenkins can queue jobs, but nothing executes until I bring the agent back.
- Manual agent management. I need to start the Jenkins agent manually on my machine, and occasionally restart it if environment variables or certain configuration changes are made.
These drawbacks don’t make the solution unusable — but they are the trade-offs for avoiding the licensing and headless issues that come with cloud-based Unity builds.
Walkthrough
Now that we’ve covered the background and the trade-offs, let’s walk through how to set up this pipeline step by step.
Prerequisites
Before getting started, make sure you have the following in place:
- Unity project stored in version control (e.g. Git)
- Jenkins running on a remote server
- SonarQube running on a remote server
- Jenkins Git plugin → Git Plugin
- Jenkins GitHub plugin → GitHub Plugin
With the prerequisites in place, the next step is configuring Jenkins to use a local inbound agent that can run Unity and Sonar scans.
Start by setting up the Git and GitHub plugins in Jenkins. Each plugin page has detailed setup instructions, and there are a few variations depending on how your Jenkins server is exposed.
Once the plugins are configured, verify that GitHub is correctly sending events to Jenkins:
You should see a webhook pointing to your Jenkins server, something like:
- Go to your repository in GitHub.
- Navigate to Settings → Webhooks.
- You should see a webhook pointing to your Jenkins server, something like –
https://my.jenkins.url/github-webhook/
This confirms that GitHub will trigger your Jenkins pipeline whenever you push code or open a pull request.
Setting up the Inbound agent
By default, Jenkins comes with a single built-in agent, but we need to create a dedicated inbound agent for Unity. Here’s how to set it up:
- On the Jenkins dashboard, click the Manage Jenkins (⚙️) icon.
- Navigate to Nodes.
- Click New Node.
- Enter a name (e.g.
local-machine) and select Permanent Agent. - Configure the following settings:
> Remote root directory → This is where Jenkins will write files on your local machine. For example- <code>C:\Jenkins
All project checkouts and pipeline working directories will live here.
> Labels → Add descriptive labels to control where pipelines run. In this case –local-machine unity msbuild
> Usage → Select Only build jobs with label expressions matching this node.
This ensures that jobs only run on this agent when explicitly requested.
> Launch method → Choose Launch agent by connecting to the controller.
This uses WebSockets, and Jenkins will generate a token for securely launching the agent.
> Availability → Set to Keep this agent online as much as possible. - Click Save.
If everything went smoothly, you should now see the agent listed on the left-hand side of the Jenkins dashboard under Build Executor Status.
Next, we’ll look at how to actually run the new agent on your local machine.
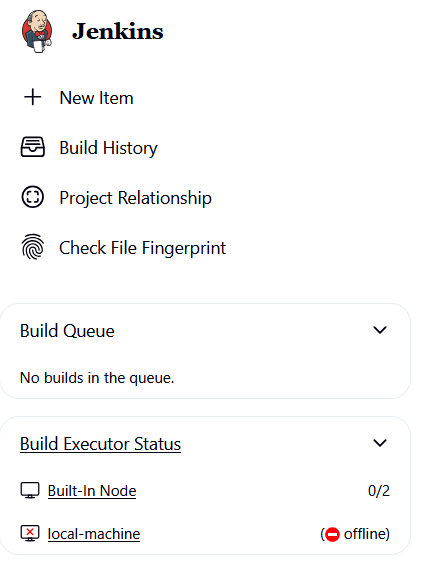
Running the Inbound Agent
In the previous step, we created an inbound agent called local-machine. At this point, you’ll notice it shows as offline in Jenkins — that’s because your local machine hasn’t yet connected back to the Jenkins controller.
Click on the local-machine agent in Jenkins, and you’ll see a page with connection instructions. Jenkins conveniently provides the exact command you need to run, tailored for different operating systems.
Since we’re running on Windows, open a Command Prompt and paste the command shown. It will look something like this (your URL and secret will differ):
curl.exe -sO https://my.jenkins.url/jnlpJars/agent.jar & java -jar agent.jar -url https://example.jenkins.com/ -secret 123456789 -name "local-machine" -webSocket -workDir "C:\Jenkins"This command does two things:
- Downloads the agent JAR from the Jenkins controller.
- Runs it with Java, which establishes a WebSocket connection back to Jenkins using the secret token.
Notice that it also includes the working directory (-workDir "C:\Jenkins") we configured earlier. That’s where Jenkins will check out code and store any temporary files for this agent.
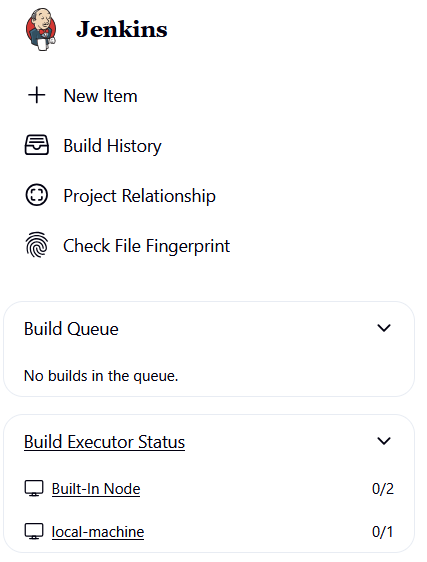
After running the command, refresh your Jenkins dashboard — the local-machine agent should now show as online, ready to accept jobs.
Matching Agents to Pipelines with Labels
Now that the agent is running, click on it in the Jenkins dashboard. You’ll see the list of labels we configured earlier:
local-machineunitymsbuild
These labels make it easy to control which jobs run on which agents. To target this agent in a pipeline, just reference one of its labels in your Jenkinsfile. For example:
pipeline {
  agent { label 'local-machine' }

  stages {
    stage('Build') {
      steps {
        echo "Running on the local-machine agent"
      }
    }
  }
}
When this pipeline runs, Jenkins will search for an agent with the matching label. Since our inbound agent is labeled local-machine, it will pick up the job.
Adding Agent Timeouts
By default, if an agent is offline, Jenkins will queue the job and wait for it to come back online. That’s useful, but if the agent stays offline too long, the build may eventually time out.
Since this setup relies on a local machine (and in my case, a laptop that frequently changes Wi-Fi networks), the WebSocket connection can drop. To avoid jobs failing too quickly, we can make Jenkins more patient by setting a longer timeout directly in the Jenkinsfile:
pipeline {
  agent { label 'local-machine' }

  options {
    timeout(time: 48, unit: 'HOURS')
  }

  stages {
    stage('Example') {
      steps {
        echo "This job can wait up to 48 hours for the agent to come online."
      }
    }
  }
}
In this example, Jenkins will wait up to 48 hours for the agent to reconnect before giving up. That number might seem high, but it’s use-case dependent. For me, it works well — I rarely have my laptop offline longer than two days, and I want queued builds to resume as soon as the agent is available again.
Generating Unity Project Files
Unity manages the .sln and .csproj files automatically, and most teams leave them out of version control. That’s fine for day-to-day development, but it creates a problem for SonarQube: Sonar requires a valid Visual Studio solution and project files in order to run its MSBuild-based analysis.
To solve this, we need to regenerate the solution before running Sonar. Unfortunately, Unity doesn’t provide a one-click CLI option for this. Instead, we can take advantage of the JetBrains Rider Editor package which exposes a method to force Unity to sync project files.
The key command looks like this:
Unity -batchmode -quit -projectPath ProjectPath -executeMethod Packages.Rider.Editor.RiderScriptEditor.SyncSolutionThis ensures Unity regenerates the .sln and .csproj files inside the project. With that in place, we can build them in the pipeline and let Sonar do its analysis
Here’s how it fits into the Jenkins stages:
    stage('Checkout') {
        steps {
            cleanWs()
            checkout scm
        }
    }
    stage('Activate Unity License') {
      steps {
        withCredentials([
          usernamePassword(
            credentialsId: 'unity-login',
            usernameVariable: 'UNITY_USERNAME',
            passwordVariable: 'UNITY_PASSWORD'
          )
        ]) {
          bat """
            "%UNITY_EDITOR_PATH%" -batchmode -nographics -quit ^
              -logFile - ^
              -username "%UNITY_USERNAME%" ^
              -password "%UNITY_PASSWORD%"
          """
        }
      }
    }
    stage('Generate Unity Project Files') {
      steps {
        bat """
              "%UNITY_EDITOR_PATH%" -batchmode -nographics -quit ^
                -projectPath "%WORKSPACE%" ^
                -executeMethod Packages.Rider.Editor.RiderScriptEditor.SyncSolution ^
                -logFile -
            """
      }
    }
    stage('Run Unity Non-Playmode Tests') {
      steps {
        script {
            bat """
                  "%UNITY_EDITOR_PATH%" -batchmode -nographics ^
                    -projectPath "%WORKSPACE%" ^
                    -runTests -testPlatform editmode ^
                    -testResults "%WORKSPACE%\\${UNITY_UNIT_TEST_RESULTS_FILE}" ^
                    -enableCodeCoverage ^
                    -coverageResultsPath "%WORKSPACE%\\Coverage" ^
                    -coverageOptions "generateAdditionalMetrics;generateHtmlReport" ^
                    -burst-disable-compilation ^
                    -logFile "%WORKSPACE%\\unityTestLog.txt"
                """
        }
      }
      post {
        always {
          script {
            if (fileExists("${env.UNITY_UNIT_TEST_RESULTS_FILE}")) {
              nunit testResultsPattern: "${env.UNITY_UNIT_TEST_RESULTS_FILE}"
              archiveArtifacts artifacts: "${env.UNITY_UNIT_TEST_RESULTS_FILE}", fingerprint: true
            }
            archiveArtifacts artifacts: "Coverage/**", allowEmptyArchive: true
          }
        }
      }
    }
At this point we’ve:
- Checked out the project.
- Validated the Unity license.
- Regenerated the
.sln/.csprojfiles. - Run editmode unit tests with code coverage enabled.
With these pieces in place, the project is now ready for the SonarQube analysis stage.
Running the SonarScanner
With the Unity setup complete (project files generated, tests executed, coverage produced), running SonarQube is the final step. Fortunately, this part is relatively straightforward.
SonarQube’s MSBuild integration always follows the same three-step pattern:
- Begin analysis — start the scanner and configure project keys, exclusions, and coverage paths.
- Build the solution — run MSBuild so Sonar can analyze the compiled C# code.
- End analysis — finalize and push the results to the SonarQube server.
Here’s what that looks like in the Jenkinsfile:
   stage('SonarQube Analysis') {
      steps {
        script {
          def scannerHome = tool 'SonarScanner_NET'
          withSonarQubeEnv('SonarQube') {
            bat "\"${scannerHome}\\SonarScanner.MSBuild.exe\" begin " +
                "/k:\"MyProject\" " +
                "/d:sonar.sourceEncoding=UTF-8 " +
                "/d:sonar.exclusions=\"**/Plugins/**/*,**/Libraries/**/*,**/Vendor/**/*,**/Samples/**,**/XR/**,**/Packages/**/*,**/ThirdParty/**/*\" " +
                "/d:sonar.cs.opencover.reportsPaths=\"%WORKSPACE%\\Coverage\\**\\*.xml\""

            bat "MSBuild.exe MyProject.sln /t:Rebuild /p:Configuration=Debug"
            bat "\"${scannerHome}\\SonarScanner.MSBuild.exe\" end"
          }
        }
      }
    }
A few details to note:
- Exclusions: Unity projects contain thousands of auto-generated or third-party files under
Plugins/,Packages/, etc. Excluding them keeps the analysis focused on your actual code. - Coverage reports: The
/d:sonar.cs.opencover.reportsPathsproperty points Sonar to the XML reports generated by Unity’s test runner in the previous stage. This lets you see test coverage metrics directly inside the SonarQube dashboard. - Project key:
/k:"MyProject"is the unique identifier for this project in SonarQube. Make sure it matches the key you configured in the SonarQube UI.
With this stage complete, Jenkins pushes a full analysis — including code quality issues and coverage — into SonarQube, where you can track it over time and enforce quality gates.
Creating the Jenkins Pipeline
With everything set up, the final step is to create the actual Jenkins pipeline.
- Create the pipeline job
- From the Jenkins dashboard, click New Item.
- Enter a name (e.g.
Unity-Sonar-Pipeline). - Select Pipeline and click OK.
- Configure the job – Most of the configuration depends on your project, but here are a few key points:
- Triggers → Select GitHub hook trigger for GITScm polling.
This lets the GitHub and Git plugins work together to trigger builds automatically when a push or pull request event is received from GitHub. - Pipeline Definition → Set this to Pipeline script from SCM.
This ensures Jenkins uses theJenkinsfilestored in your repository, keeping pipeline logic version-controlled alongside your code. - Branches to build → Adjust this to fit your workflow.
In my case, I added two branch specifiers:origin/MyProject-*(feature branches)origin/master(main branch)
This way, Jenkins ignores temporary throwaway branches but still builds PR branches and the main line of development.
- Triggers → Select GitHub hook trigger for GITScm polling.
- Kick off the first build
I found that webhooks didn’t trigger until after the first manual build. So run one build manually to “prime” Jenkins, and after that GitHub webhooks should trigger new builds automatically.
Triggering the pipeline
With everything in place, we’re finally ready to trigger our first build.
Below is the complete Jenkinsfile for reference. This pulls together all the steps we’ve covered so far — checking out the code, activating the Unity license, generating project files, running tests with coverage, and finally running SonarQube analysis.
pipeline {
  agent { label 'local-machine' }

  options {
    timeout(time: 48, unit: 'HOURS')
  }

  environment {
    PROJECT_NAME = 'MyProject'
    UNITY_UNIT_TEST_RESULTS_FILE = 'UnityTestResults.xml'
  }

  tools { msbuild 'ms22' }

  stages {
    stage('Checkout') {
        steps {
            cleanWs()
            checkout scm
        }
    }
    stage('Activate Unity License') {
      steps {
        withCredentials([
          usernamePassword(
            credentialsId: 'unity-login',
            usernameVariable: 'UNITY_USERNAME',
            passwordVariable: 'UNITY_PASSWORD'
          )
        ]) {
          bat """
            "%UNITY_EDITOR_PATH%" -batchmode -nographics -quit ^
              -logFile - ^
              -username "%UNITY_USERNAME%" ^
              -password "%UNITY_PASSWORD%"
          """
        }
      }
    }
    stage('Generate Unity Project Files') {
      steps {
        bat """
              "%UNITY_EDITOR_PATH%" -batchmode -nographics -quit ^
                -projectPath "%WORKSPACE%" ^
                -executeMethod Packages.Rider.Editor.RiderScriptEditor.SyncSolution ^
                -logFile -
            """
      }
    }
    stage('Run Unity Non-Playmode Tests') {
      steps {
        script {
            bat """
                  "%UNITY_EDITOR_PATH%" -batchmode -nographics ^
                    -projectPath "%WORKSPACE%" ^
                    -runTests -testPlatform editmode ^
                    -testResults "%WORKSPACE%\\${UNITY_UNIT_TEST_RESULTS_FILE}" ^
                    -enableCodeCoverage ^
                    -coverageResultsPath "%WORKSPACE%\\Coverage" ^
                    -coverageOptions "generateAdditionalMetrics;generateHtmlReport" ^
                    -burst-disable-compilation ^
                    -logFile "%WORKSPACE%\\unityTestLog.txt"
                """
        }
      }
      post {
        always {
          script {
            if (fileExists("${env.UNITY_UNIT_TEST_RESULTS_FILE}")) {
              nunit testResultsPattern: "${env.UNITY_UNIT_TEST_RESULTS_FILE}"
              archiveArtifacts artifacts: "${env.UNITY_UNIT_TEST_RESULTS_FILE}", fingerprint: true
            }
            archiveArtifacts artifacts: "Coverage/**", allowEmptyArchive: true
          }
        }
      }
    }
    stage('SonarQube Analysis') {
      steps {
        script {
          def scannerHome = tool 'SonarScanner_NET'
          withSonarQubeEnv('MyProjectQube') {
            bat "\"${scannerHome}\\SonarScanner.MSBuild.exe\" begin " +
                "/k:\"MyProject\" " +
                "/d:sonar.sourceEncoding=UTF-8 " +
                "/d:sonar.exclusions=\"**/Plugins/**/*,**/Libraries/**/*,**/Vendor/**/*,**/Samples/**,**/XR/**,**/Packages/**/*,**/ThirdParty/**/*\" " +
                "/d:sonar.cs.opencover.reportsPaths=\"%WORKSPACE%\\Coverage\\**\\*.xml\""

            bat "MSBuild.exe MyProject.sln /t:Rebuild /p:Configuration=Debug"
            bat "\"${scannerHome}\\SonarScanner.MSBuild.exe\" end"
          }
        }
      }
    }
  }
}
First Run
Before GitHub webhooks will trigger jobs automatically, you’ll likely need to manually run the first build in Jenkins. This primes the pipeline and makes sure everything is wired up correctly.
After that:
- Make a change in your branch.
- Push the commit.
- Check the GitHub Hook Log in Jenkins
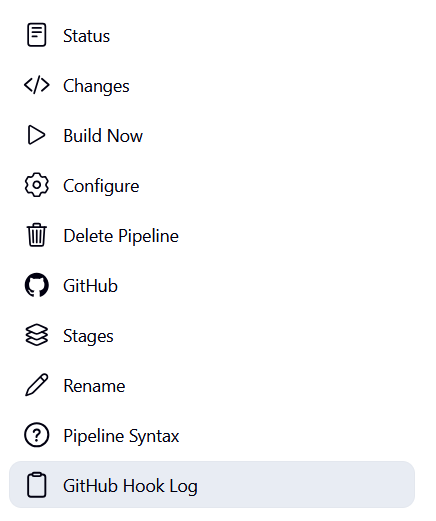
You should see entries like this:
Seen 73 remote branches
 > git show-ref --tags -d # timeout=10
 > git log --full-history --no-abbrev --format=raw -M -m f73c03bf3ea8b7ae03471ff97ccd458c0b6bd971..b8ac068982f4238bf8d0823d1c18bb431cfe3e44 # timeout=10
Done. Took 12 sec
Changes found
This means Jenkins detected the commit and started a new build.
If all went well you should finally see the results on your SonarQube server
Results
If everything went smoothly, the pipeline will:
- Run Unity in batchmode to generate project files.
- Execute editmode tests with code coverage enabled.
- Send results to Jenkins (via NUnit and archived artifacts).
- Rebuild the solution with SonarScanner hooks.
- Publish code quality and coverage metrics to SonarQube.
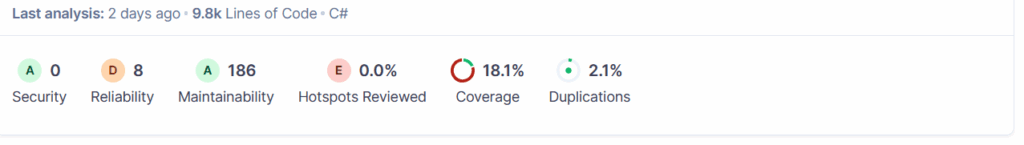
Finally, you’ll be able to view your results in SonarQube’s dashboard:
- Test coverage
- Code smells
- Duplications
- Bugs and vulnerabilities
- Quality gate status
This is where all the effort pays off — automated Unity testing and SonarQube analysis running cleanly inside Jenkins. 🎉
Wrapping It Up
Setting up a Unity pipeline with Jenkins and SonarQube isn’t as straightforward as it is with more traditional .NET or Java projects. Between Unity’s licensing quirks, the lack of a true headless mode, and SonarQube’s strict requirements around building from solution files, it’s easy to get stuck chasing dead ends.
I am also aware there could be solutions out there and I would be surprised if wasn’t missing a few tricks in setting up Unity pipelines, so I guess this is my own journey and hopefully I can learn about other solutions out there.
Inbound agents turned out to be the key that unlocked everything. By letting Jenkins orchestrate builds on my local development machine, I was able to:
- Run Unity in batchmode for test execution and code coverage.
- Generate solution files on demand (via Rider integration).
- Execute SonarScanner in the correct order to capture results.
- Keep Jenkins and SonarQube hosted remotely for centralized dashboards.
Is this the perfect, cloud-native pipeline? Not quite. For a large team, scaling across multiple agents or moving to Unity DevOps with an enterprise license would probably be a better long-term play. But for a solo developer (or a small team experimenting with CI), this approach strikes a great balance — it’s reliable, flexible, and avoids most of the pain points that derail other setups.
At the end of the day, the pipeline now does exactly what I need: run Unity tests, measure coverage, feed results into SonarQube, and keep my quality gates green. And just as importantly — it does it automatically whenever I push code.
If you’ve been struggling to get Unity working cleanly with Jenkins and SonarQube, I hope this walkthrough saves you a few of the headaches I had along the way.
Leave a Reply